Fiber for Diabetes, With the Effect Size Behind Every Claim
Last updated: September 26, 2026
Increasing dietary fiber lowers HbA1c by 2.00 mmol/mol (95% CI -3.30 to -0.71), which is about 0.18 percentage points on the US scale, and fasting glucose by 0.56 mmol/L, about 10 mg/dL. Those are pooled results from 33 and 34 randomized trials inside a review of 42 trials in 1,789 adults with prediabetes, type 1 or type 2 diabetes (Reynolds, Akerman and Mann, PLoS Medicine 2020).
Every page on this subject says fiber helps blood sugar. Almost none says by how much, which markers moved, or how good the evidence is for each one. That review answers all three, and two of its findings cut against the standard advice.
This page carries the effect size for every marker it measured, the evidence grade attached to each, the reason the HbA1c result is shakier than it looks, and a column no other page on this topic publishes: how much fiber each food gives you per gram of the carbohydrate it costs. The clinical figures come from the named studies, listed in full on our sources page. The food figures are computed from USDA FoodData Central records read in September 2026.
How much does more fiber actually lower blood sugar?
The honest answer is a real but modest amount, and the units matter because they make it look bigger or smaller than it is.
HbA1c fell 2.00 mmol/mol against control. US labs report HbA1c as a percentage, and the standard conversion works out at about 0.09 percentage points per mmol/mol, so 2.00 mmol/mol is roughly 0.18 percentage points. An HbA1c of 7.5 percent becomes 7.3 percent. Fasting plasma glucose fell 0.56 mmol/L, about 10 mg/dL, across 34 trials.
The American Diabetes Association’s nutrition consensus report reaches a compatible figure from different studies: A1C reductions of 0.2 to 0.3 percentage points, at intakes above 50 grams a day, with the note that intakes that high often cause flatulence, bloating and diarrhea.
Fiber is a real effect, not a drug-sized one. About 0.18 percentage points of HbA1c is worth having and worth stacking with everything else. It is not a substitute for medication, and no source on this page claims otherwise.
Two things make that number more interesting than its size. The trials ran short, mostly 6 to 12 weeks, so this is the effect of a diet change measured almost immediately. And the same fiber intake was linked to a much larger difference in how long people lived, which is the section further down.
Which markers moved, and how strong is the evidence
This is the table the review makes possible and nobody prints. The GRADE column is the review’s own quality rating for each outcome, which is the part that tells you how much weight a number can carry.
| Marker | Change on higher fiber | 95% confidence interval | Trials | Evidence grade |
|---|---|---|---|---|
| Fasting plasma glucose | -0.56 mmol/L about 10 mg/dL | -0.73 to -0.38 | 34 | High |
| Total cholesterol | -0.34 mmol/L about 13 mg/dL | -0.46 to -0.22 | 27 | High |
| LDL cholesterol | -0.17 mmol/L about 6.6 mg/dL | -0.27 to -0.08 | 21 | High |
| HbA1c | -2.00 mmol/mol about 0.18 points | -3.30 to -0.71 | 33 | Moderate |
| Triglycerides | -0.16 mmol/L about 14 mg/dL | -0.23 to -0.09 | 28 | Moderate |
| Fasting insulin | -2.03 standardized | -2.92 to -1.13 | 19 | Moderate |
| Insulin resistance (HOMA-IR) | -1.24 | -1.72 to -0.76 | 9 | Moderate |
| C-reactive protein | -2.80 standardized | -4.52 to -1.09 | 7 | Moderate |
| Body weight | -0.56 kg about 1.2 lb | -0.98 to -0.13 | 18 | Moderate |
| Body mass index | -0.36 kg/m2 | -0.55 to -0.16 | 14 | Moderate |
| Waist circumference | -1.42 cm about 0.6 in | -2.63 to -0.21 | 8 | Moderate |
| Blood pressure | no change | - | - | Moderate |
Three results were graded high quality, and they are the three with a clear dose response: fasting glucose, total cholesterol and LDL. The higher the intake, the bigger the improvement, which is the pattern that makes a causal reading reasonable. Everything else was graded moderate, mostly after a downgrade for heterogeneity, because the trials disagreed with each other a great deal (I² of 90 percent or more on every pooled trial outcome).
Blood pressure is the clean null. Increasing fiber did not move systolic or diastolic pressure, and meta regression found that result robust. It is worth stating plainly, because “fiber is good for your heart” pages tend to imply otherwise. The lipid improvements are the cardiovascular story here, not the pressure ones.
The weight results deserve a note. A loss of 0.56 kg over 6 to 12 weeks came without any advice to eat less, which is the point of measuring it. If weight is the goal rather than a side effect, how to scale fiber to a calorie deficit is a different calculation.
The HbA1c result has a confound worth knowing about
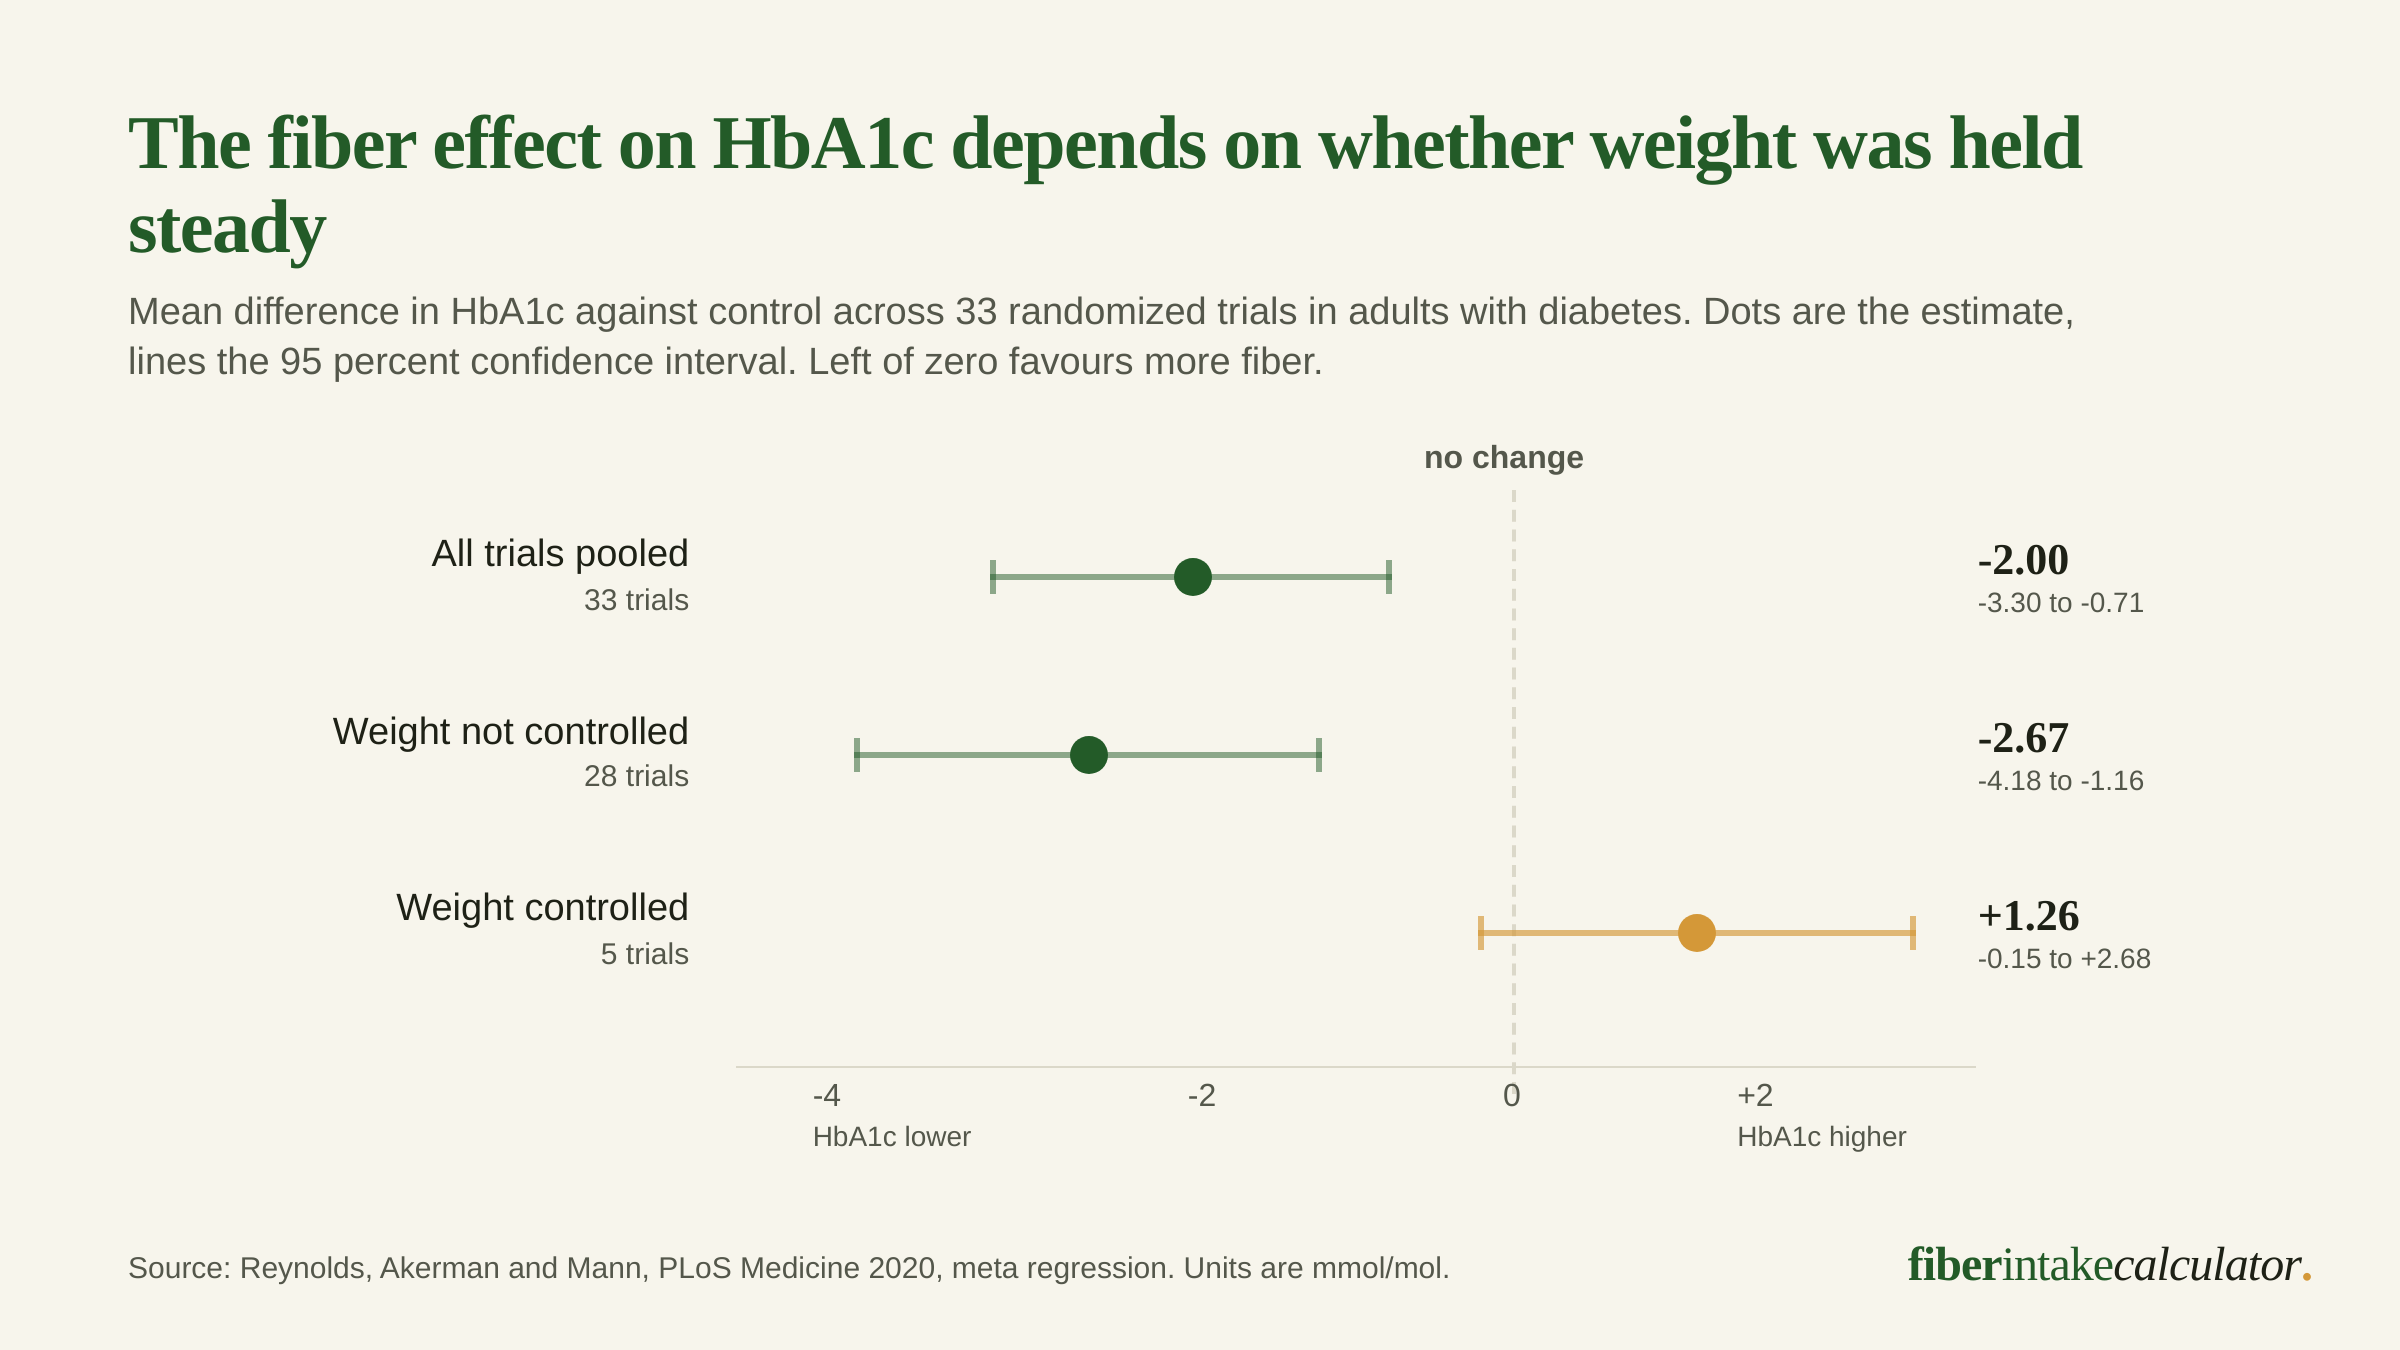
Meta regression split the HbA1c trials by whether they held participants’ weight steady, and the two halves point in opposite directions. In the 28 trials that did not control weight, HbA1c fell 2.67 mmol/mol (95% CI -4.18 to -1.16). In the 5 trials that did, it rose 1.26 mmol/mol (95% CI -0.15 to 2.68), an interval that crosses zero.
The review authors state the implication rather than bury it: weight loss may have been responsible for the effect on HbA1c. They also say why that reading is not certain, which is that only 5 trials fit the weight-controlled group, so the comparison rests on very little.
What this changes in practice: nothing about eating more fiber, something about expecting it to work by itself. If a higher-fiber diet also brings your weight down a little, the blood sugar improvement may be coming through that route. Most people do not need the mechanism separated. It matters if you are weight stable and wondering why your numbers have not moved.
Fasting glucose splits on a different variable. In the 15 trials that included people with comorbidities beyond diabetes, glucose fell 0.91 mmol/L (95% CI -1.46 to -0.36). In the 19 trials that excluded them, it fell 0.26 mmol/L (95% CI -0.46 to -0.05). Sicker groups moved further, which is common and is worth knowing if your own numbers are close to target already.
The soluble fiber rule does not survive the analysis
Search this topic and you will be told that soluble fiber is the one that helps blood sugar, because it forms a gel and slows digestion. The CDC’s fiber and diabetes page says exactly that, and so does Google’s AI Overview.
Meta regression across the 42 trials tested it and came up empty. Fiber type did not influence the size of the improvement in HbA1c, fasting glucose, total cholesterol, LDL or triglycerides. Neither did diabetes type, diabetes medication, trial risk of bias, trial size or trial duration. The review states the conclusion directly: the source and type of dietary fiber did not influence the extent of the improvements.
The single fiber-type difference it did find runs the opposite way to the folk rule. HDL cholesterol rose more in trials of non-viscous fiber, 0.11 mmol/L across 6 trials, than in trials of viscous fiber, 0.02 mmol/L across 11 trials.
None of this makes the soluble and insoluble distinction useless. It is real chemistry with real consequences elsewhere: viscous soluble fiber is what the FDA heart claim for psyllium rests on, and our soluble fiber page puts the gel-forming grams next to the bulking ones food by food, while the insoluble fiber page does the same from the other side. What the evidence does not support is using that distinction to choose foods for glycemic control. On that outcome, total grams is the variable that behaved.
Fiber per gram of net carb, the number a carb counter needs
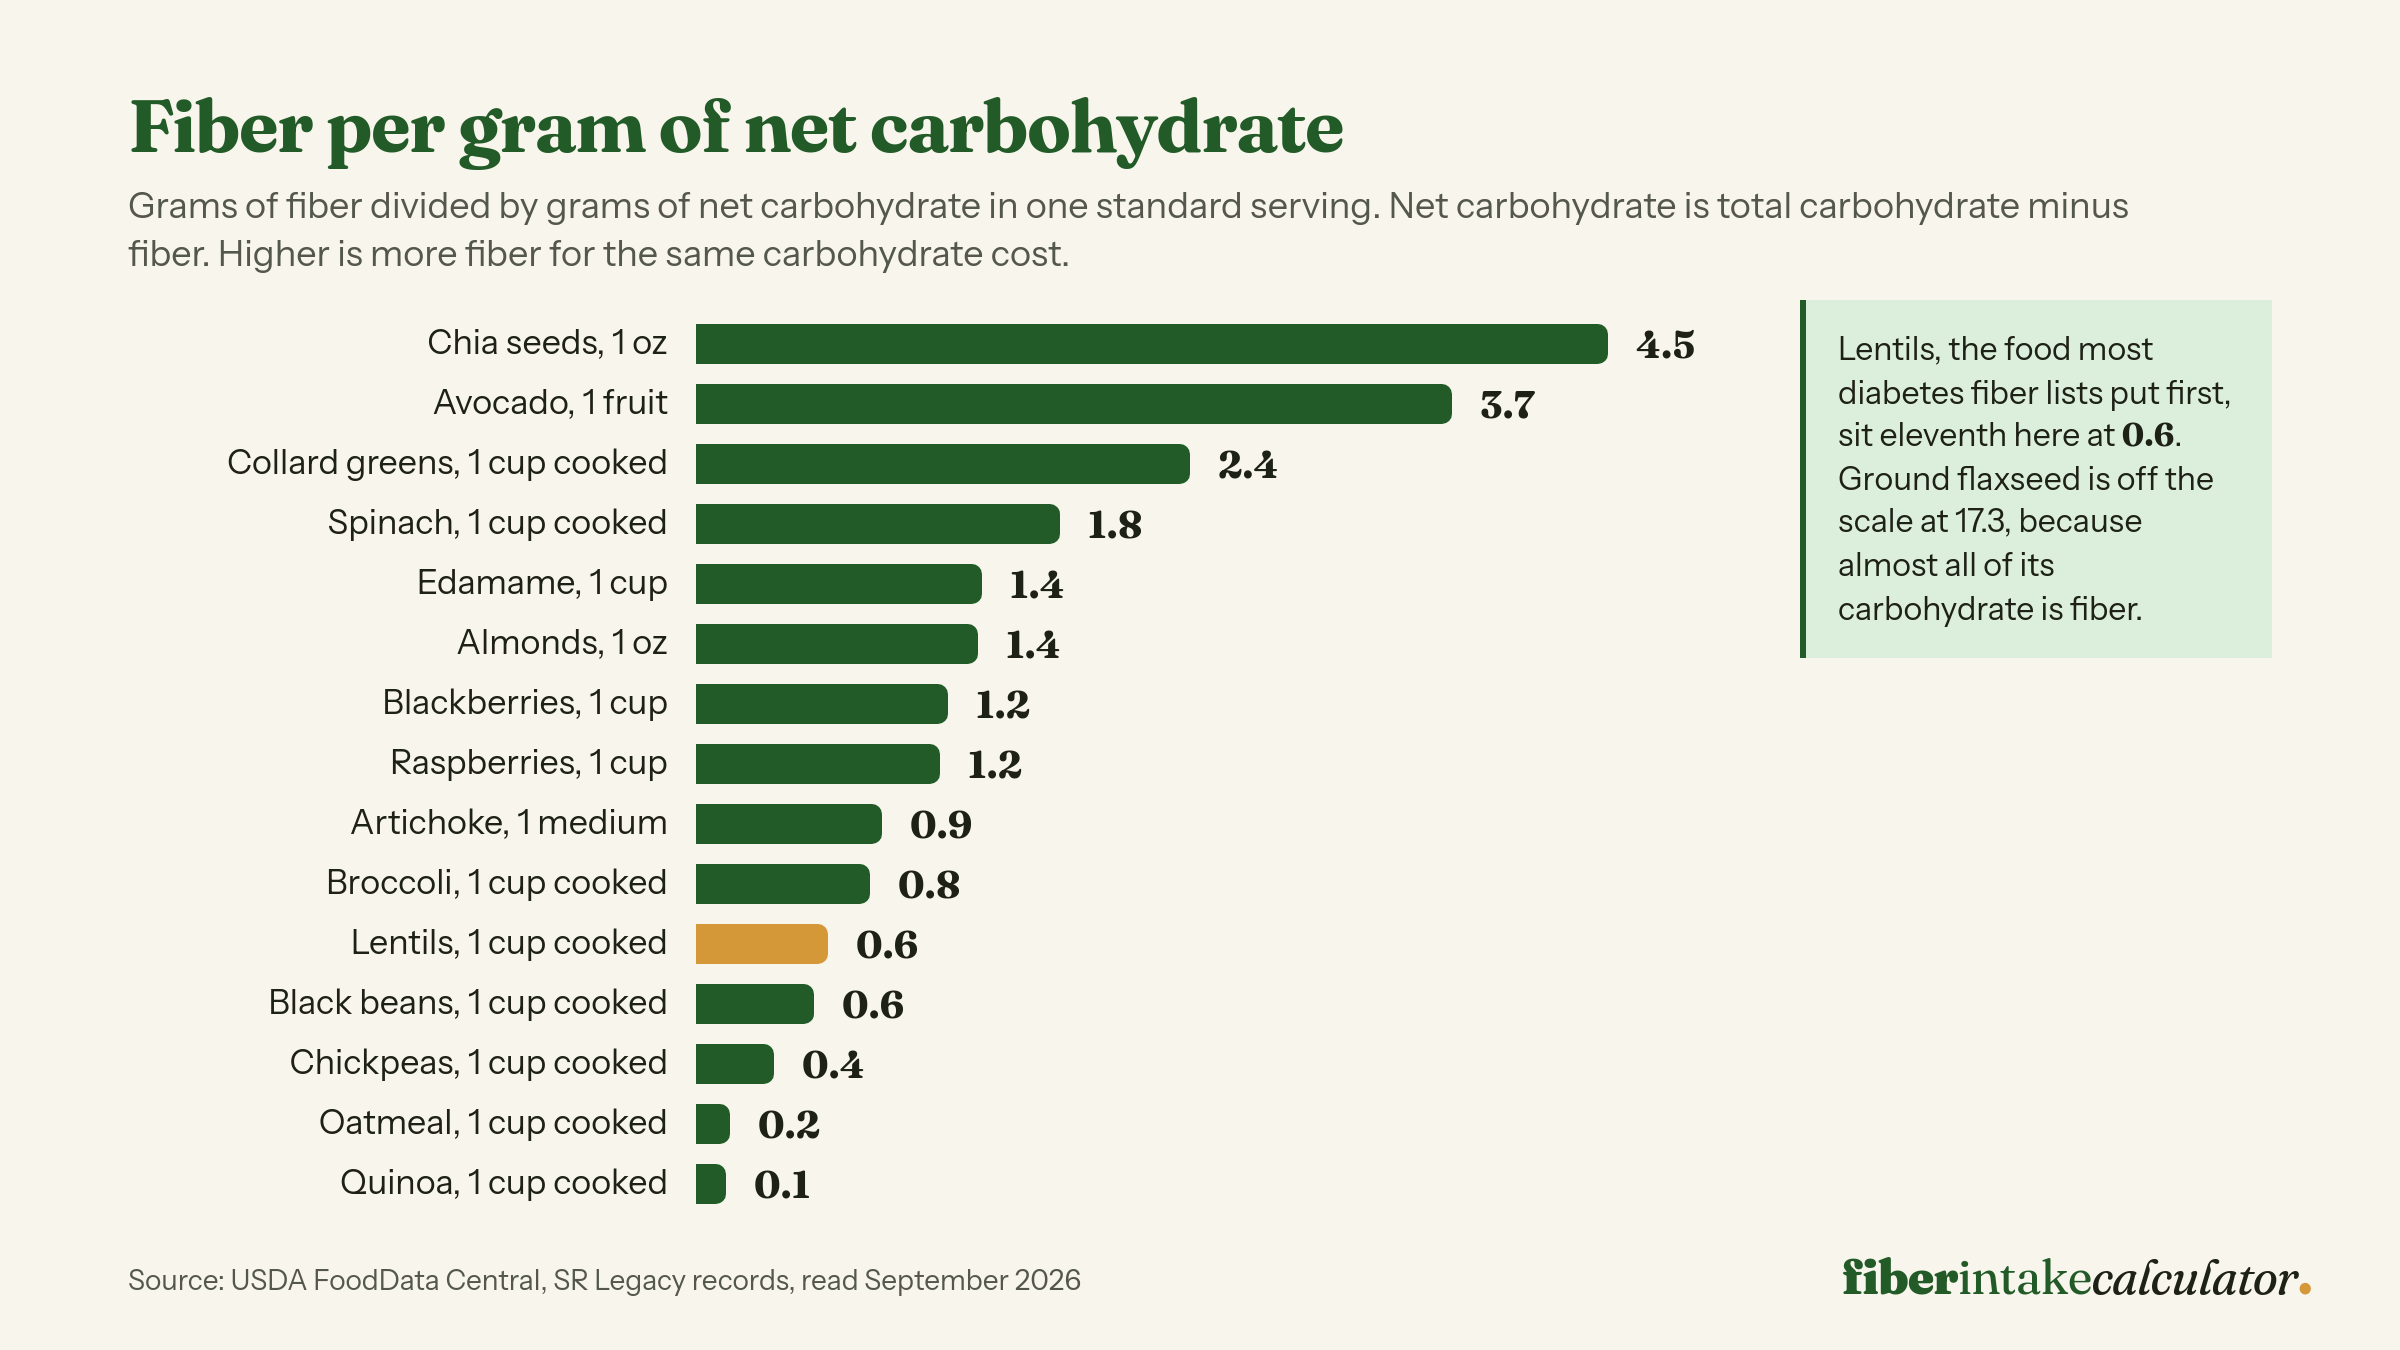
Here is the practical gap in every food list on this topic. They rank foods by fiber per serving, which is the right question for a general reader and the wrong one for somebody counting carbohydrate. A cup of chickpeas carries 12.5 grams of fiber, and it also carries 32.5 grams of net carbohydrate to get there. A cup of cooked collard greens carries 7.6 grams of fiber for 3.1 grams of net carb.
The ratio below is fiber divided by net carbohydrate, per standard serving, computed from USDA FoodData Central records. Sort any column by clicking its header.
| Food | Fiber per g of net carb | Serving | Fiber (g) | Net carb (g) | Calories |
|---|---|---|---|---|---|
| Flaxseed, ground | 17.3 | 2 tbsp (14 g) | 3.8 | 0.2 | 75 |
| Chia seeds | 4.5 | 1 oz (28 g) | 9.8 | 2.2 | 138 |
| Avocado, California | 3.7 | 1 fruit (136 g) | 9.2 | 2.5 | 227 |
| Collard greens, cooked | 2.4 | 1 cup chopped | 7.6 | 3.1 | 63 |
| Spinach, cooked | 1.8 | 1 cup | 4.3 | 2.4 | 41 |
| Edamame, cooked | 1.4 | 1 cup | 8.1 | 5.8 | 188 |
| Almonds | 1.4 | 1 oz (23 kernels) | 3.5 | 2.6 | 164 |
| Blackberries | 1.2 | 1 cup | 7.6 | 6.2 | 62 |
| Raspberries | 1.2 | 1 cup | 8.0 | 6.7 | 64 |
| Artichoke, cooked | 0.9 | 1 medium | 6.8 | 7.5 | 64 |
| Broccoli, cooked | 0.8 | 1 cup chopped | 5.1 | 6.1 | 55 |
| Lentils, cooked | 0.65 | 1 cup | 15.6 | 24.2 | 230 |
| Split peas, cooked | 0.65 | 1 cup | 16.3 | 25.1 | 231 |
| Brussels sprouts, cooked | 0.58 | 1 cup | 4.1 | 7.0 | 56 |
| Black beans, cooked | 0.58 | 1 cup | 15.0 | 25.8 | 227 |
| Green peas, cooked | 0.54 | 1 cup | 8.8 | 16.2 | 134 |
| Kidney beans, cooked | 0.48 | 1 cup | 13.1 | 27.3 | 225 |
| Chickpeas, cooked | 0.38 | 1 cup | 12.5 | 32.5 | 269 |
| Strawberries | 0.35 | 1 cup whole | 2.9 | 8.2 | 46 |
| Bulgur, cooked | 0.32 | 1 cup | 8.2 | 25.6 | 151 |
| Oat bran, cooked | 0.29 | 1 cup | 5.7 | 19.4 | 88 |
| Pear, with skin | 0.26 | 1 medium | 5.5 | 21.6 | 101 |
| Popcorn, air-popped | 0.23 | 3 cups | 3.5 | 15.2 | 93 |
| Apple, gala, with skin | 0.20 | 1 medium | 4.0 | 19.6 | 98 |
| Sweet potato, baked in skin | 0.19 | 1 medium (114 g) | 3.8 | 19.8 | 103 |
| Oatmeal, cooked | 0.17 | 1 cup | 4.0 | 24.1 | 166 |
| Whole-grain pasta, cooked | 0.17 | 1 cup spaghetti | 5.3 | 31.2 | 184 |
| Barley, pearled, cooked | 0.16 | 1 cup | 6.0 | 38.3 | 193 |
| Quinoa, cooked | 0.15 | 1 cup | 5.2 | 34.2 | 222 |
The order is close to the reverse of the standard advice list. Legumes and whole grains lead almost every “best high-fiber foods for diabetes” list, and on this measure they sit in the middle and at the bottom. That is not an argument against eating them. A cup of lentils still delivers 15.6 grams of fiber, more than twice what a cup of collards gives, and our legume rankings exist because that density is hard to beat. It is an argument that if your carbohydrate budget is the binding constraint, the seeds, the berries, the leafy greens and the avocado do more work per gram than the whole grains do. Our ranking of high-fiber low-carb foods takes that set on its own and prices a whole day from it: 38.7 g of fiber for 12.1 g of net carbohydrate, against 99.7 g for the lentil and oatmeal route to a smaller total.
Two notes on the method, because this column is easy to misread.
Net carbohydrate is not a term any federal rule defines. What is defined is the number it starts from. Under 21 CFR 101.9(c)(6), total carbohydrate on a US label is calculated by subtracting protein, fat, moisture and ash from the weight of the food, so fiber is already counted inside it. Subtracting fiber back out is a convention, useful for comparing foods, and it is the convention this table uses.
Ground flaxseed sits far off the scale at 17.3 because nearly all of its carbohydrate is fiber: 27.3 grams of fiber in 28.9 grams of carbohydrate per 100 grams. When the denominator is that small, the ratio swings on rounding, so read flax and chia as “almost free” rather than as precise values. The same caution does not apply further down the table, where net carb is large enough to divide by comfortably. How we handle figures like this is set out on our methodology page.
The dose: 35 grams, or 15 more than you eat now
The mortality evidence is the strongest reason to care about this, and it comes from the cohort half of the same review: 8,300 adults with type 1 or type 2 diabetes across 22 countries, followed for a mean of 8.8 years.
Comparing the highest fiber intakes with the lowest, all-cause mortality was 45 percent lower (RR 0.55, 95% CI 0.35 to 0.86), with no heterogeneity between the cohorts. Put as a dose, an intake of 35 grams a day against the 19 gram average was associated with 35 percent lower all-cause mortality (95% CI 10 to 48 percent), which works out at 14 fewer deaths per 1,000 people (95% CI 4 to 19) over the study period. The curve is not a straight line: the steepest part of it is at the low end.
| Target | Where it comes from | What it is based on |
|---|---|---|
| 14 g per 1,000 kcal | American Diabetes Association nutrition consensus report, matching the Dietary Guidelines | A floor, with at least half of grains whole and intact |
| 22 to 34 g a day | Dietary Guidelines for Americans, as the CDC states it | General adult range by age and sex |
| 35 g a day | Reynolds 2020, cohort dose response | The intake with 35 percent lower all-cause mortality against 19 g |
| current intake plus 15 g | Reynolds 2020, alternative framing of the same target | Because most adults in these populations eat about 20 g |
| above 50 g a day | ADA consensus, citing A1C studies | 0.2 to 0.3 A1C points, often with flatulence, bloating and diarrhea |
The review adds a detail that makes the “plus 15 grams” framing the more useful one. The dose response curves for HbA1c and fasting glucose had to be plotted against baseline intake, not against absolute grams, because the benefit depended on where people started. Moving from a low intake to a moderate one did more than moving from moderate to high.
Which means the first question is what you eat now, not what the target is. Our fiber calculator gives your own daily number from age, sex or calorie intake, and the general food rankings show what closing a 15 gram gap looks like in servings.
One more distinction the supplement market glosses over. The mortality benefit was observed in people whose fiber came principally from food rather than from manufactured products with extracted or synthetic fiber added. The review says a role for supplements should not be excluded, and that no trial has yet shown they deliver comparable long-term clinical benefit. Our fiber supplement comparison is built for closing a gap, which is the job supplements have evidence for.
What the trials cannot tell you yet
The evidence base is better than most nutrition questions get and thinner than it looks.
It is short. Of the 42 trials, 93 percent ran 6 to 12 weeks and exactly one ran a full year. Every glycemic figure on this page is a short-term result. The long-term picture comes from observational cohorts, which cannot rule out confounding however consistent they are.
It is thin outside type 2. Only 2 of the 42 trials were in type 1 diabetes, and no eligible trial in gestational diabetes existed to include. Meta regression did not find diabetes type changed any result, and a separate cohort analysis found the same fiber and HbA1c relationship in type 1, but 2 trials is 2 trials.
The trials disagree with each other. Heterogeneity was I² of 90 percent or more for every pooled trial outcome. Influence analysis, publication bias tests and meta regression all failed to find a single cause. The cohorts, by contrast, agreed closely (I² of 10 percent or less) and both scored 8 of 9 on the Newcastle-Ottawa quality scale.
Glycemic index is a separate question with a weaker answer. The ADA consensus report notes that two systematic reviews of glycemic index and glycemic load in people with diabetes found no significant effect on A1C and mixed results on fasting glucose. Ranking foods by glycemic index is not the same move as raising total fiber.
Talk to your diabetes team before you change this much fiber. A large increase in fiber changes how fast carbohydrate is absorbed, which can change what your current insulin or medication doses do. If you dose against carbohydrate counts, it also matters whether you subtract fiber. Add fiber over weeks rather than days, and raise the plan with the people managing your treatment.
For how this dose compares with the amounts tested in other conditions, our overview of fiber across specific conditions puts every effect size and tested dose in one table, from the 7 to 20 grams used in hemorrhoid trials to the 25 grams associated with lower diverticulitis risk.
Frequently asked questions
Can fiber reduce A1C?
Yes, by a small and well-measured amount. Pooled across 33 randomized trials in adults with diabetes, increasing fiber lowered HbA1c by 2.00 mmol/mol (95% CI -3.30 to -0.71), which is about 0.18 percentage points on the US scale (Reynolds, Akerman and Mann, PLoS Medicine 2020). The American Diabetes Association's nutrition consensus report cites A1C reductions of 0.2 to 0.3 percentage points at intakes above 50 grams a day, and notes that such intakes often bring flatulence, bloating and diarrhea. So fiber moves the number in the right direction without being the size of a medication effect.
How much fiber should a type 2 diabetic eat per day?
The American Diabetes Association sets the floor at 14 grams per 1,000 calories, the same figure as the Dietary Guidelines, with at least half of grain intake as whole intact grains. The trial and cohort work points higher: comparing 35 grams a day with the 19 gram average, all-cause mortality was 35 percent lower (95% CI 10 to 48 percent), and the authors suggest either reaching 35 grams a day or adding 15 grams to your current intake. Our calculator turns the per-calorie rule into your own number.
Which type of fiber is best for lowering blood sugar?
The largest analysis of this question could not find a difference. Meta regression across the 42 trials found that fiber type did not influence the size of the improvement in HbA1c, fasting glucose, total cholesterol, LDL or triglycerides, and neither did diabetes type, diabetes medication, trial size or trial duration. The popular rule that soluble fiber is the blood sugar one is not supported by that analysis. The one fiber-type difference it did find runs the other way: HDL cholesterol rose more in trials of non-viscous fiber, 0.11 mmol/L from 6 trials, than viscous fiber, 0.02 mmol/L from 11 trials.
Should you subtract fiber from carbs when counting carbohydrates?
Net carbohydrate has no federal definition, so subtracting is a convention rather than a rule. What is defined is the number you start from: under 21 CFR 101.9(c)(6), total carbohydrate on a US label is calculated by subtracting protein, fat, moisture and ash from the weight of the food, which means fiber is already inside it. Subtracting fiber back out gives a useful comparison between foods, and it is what the ranking on this page uses. If you dose insulin against carbohydrate counts, the subtraction changes your dose, so agree the method with your diabetes team rather than adopting it from a food label.
What is the best fiber supplement for people with type 2 diabetes?
For glycemic markers, the trials give no basis for preferring one, since fiber type did not predict the size of the effect. For the outcome that matters most, the evidence favours food. The reduction in premature mortality was observed in cohorts whose fiber came principally from food rather than from manufactured foods with extracted or synthetic fiber added, and the review authors say directly that no trial has shown supplements confer comparable long-term clinical benefit. The American Diabetes Association takes the same position. A supplement is a reasonable way to close a gap, especially on a lower-carbohydrate diet, and our supplement comparison puts the label doses side by side.
Built and maintained by the FiberIntake team, with data from USDA FoodData Central and peer-reviewed sources. Figures are checked against the cited source before publish. About this site →