Fiber for Specific Conditions, With the Numbers Attached
Last updated: September 27, 2026
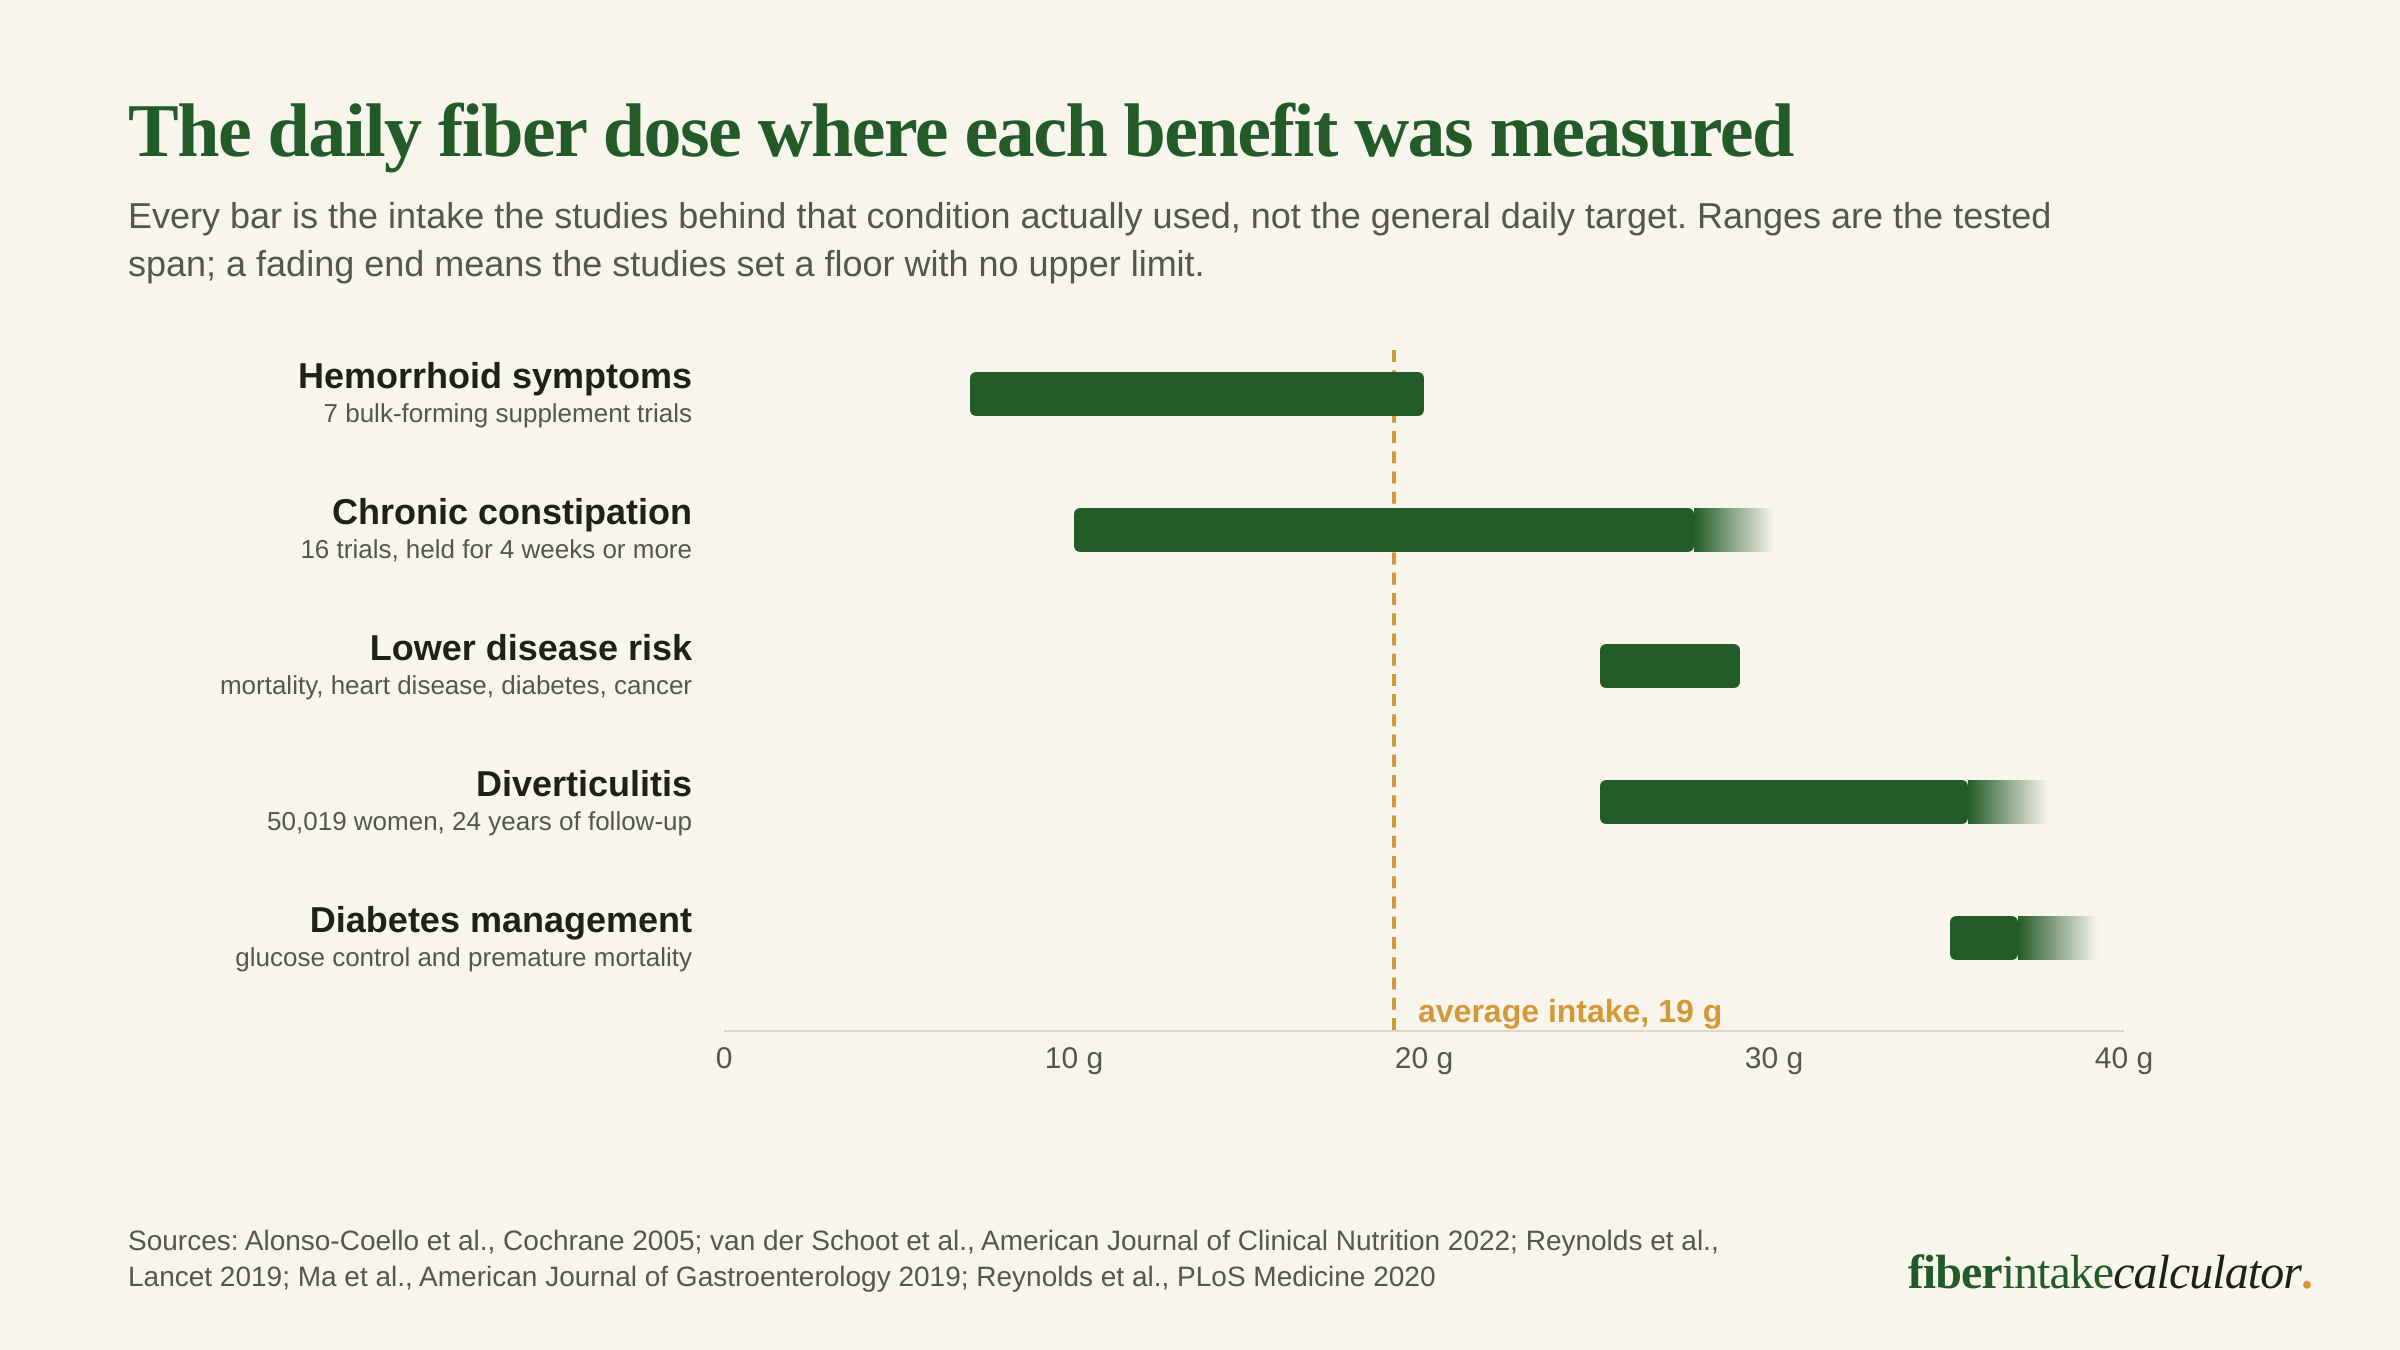
Fiber is not one intervention with one dose. Across the conditions it has been tested in, the measured effect ranges from a number needed to treat of 7 in irritable bowel syndrome down to no detectable change at all for hemorrhoid prolapse, and the daily dose that produced each result runs from 7 grams to 35 grams.
Nearly every page on this subject prints a benefits list instead. This one prints the effect size, the fiber type that carried it, and the dose the study actually used, condition by condition, including the places where fiber did nothing.
Every clinical figure names its study and is listed in full on our sources page. Food figures come from USDA FoodData Central, read in September 2026. Blood values reported in mmol/L are converted to US units at the standard factors, 18.0 for glucose and 38.7 for cholesterol.
What fiber does for each condition, with the number
| Condition | What moved | Best estimate | The fiber and dose that did it | Study |
|---|---|---|---|---|
| Chronic constipation | Responder rate | 66% vs 41% | Supplements above 10 g a day, held 4 weeks or more | van der Schoot 2022, 16 trials, 1,251 adults |
| Hemorrhoids | Symptoms persisting | RR 0.47 0.32 to 0.68 | Bulk-forming supplement, 7 to 20 g a day | Cochrane 2005, 7 trials, 378 patients |
| Irritable bowel syndrome | Symptoms persisting | RR 0.86 0.80 to 0.94 | Soluble fiber only. Bran showed nothing | Moayyedi 2014, 14 trials, 906 patients |
| Diverticulitis | First attack | HR 0.86 0.78 to 0.95 | 25 g a day or more, fruit fiber strongest | Ma 2019, 50,019 women, 4,343 cases |
| Diabetes | HbA1c | -2.0 mmol/mol about 0.18 points | Higher intake, any fiber type, both diabetes types | Reynolds 2020, 33 trials |
| Diabetes | Premature death | 14 fewer per 1,000 4 to 19 | 35 g a day against the 19 g average | Reynolds 2020, 8,300 adults, 8.8 years |
| High cholesterol | LDL cholesterol | -2.2 mg/dL per gram per day | Soluble fiber only, tested at 2 to 10 g a day | Brown 1999, 67 controlled trials |
| Gut bacteria | Bifidobacterium abundance | +0.64 SMD 0.42 to 0.86 | Fructans and galacto-oligosaccharides. Diversity did not move | So 2018, 64 trials, 2,099 adults |
| General disease risk | Death, heart disease, stroke, type 2 diabetes, colorectal cancer | 15 to 30% lower | Highest intake vs lowest, curve steepest at 25 to 29 g | Reynolds 2019, 185 studies |
The one thing to carry away. The conditions with randomized trial evidence for treating symptoms are constipation, hemorrhoids and irritable bowel syndrome. Everything else on this table is prevention or a risk-factor improvement, which is a different claim with a different strength of evidence behind it.
The dose is different for every condition
The 25 to 38 grams quoted everywhere is the Institute of Medicine’s Adequate Intake for general health. It is not the dose any of these studies tested, and in two conditions it is more than double what the trials used.
The constipation trials found their effect above 10 grams a day, which is roughly two thirds of a cup of cooked lentils. The hemorrhoid trials used 7 to 20 grams of a bulk-forming supplement. Both are well under a typical daily target. Our fiber for constipation page converts each trial arm into food, and the best-tolerated arm delivered 4.1 grams a day.
At the other end, the diabetes work points at 35 grams a day, above almost every general target, and the population risk curve is steepest between 25 and 29 grams. Our fiber for diabetes page carries the dose response behind that 35 gram figure, along with the alternative framing the same authors offer, which is 15 grams more than whatever you eat now.
Work out your general daily target with the fiber calculator, then read it as a floor for overall health rather than as the dose for any one condition. The two numbers answer different questions. The formula behind the target is on our methodology page.
Where fiber did nothing
Benefits lists have no room for null results, which is a problem, because the null results are what tell you when to stop adding fiber and go see someone.
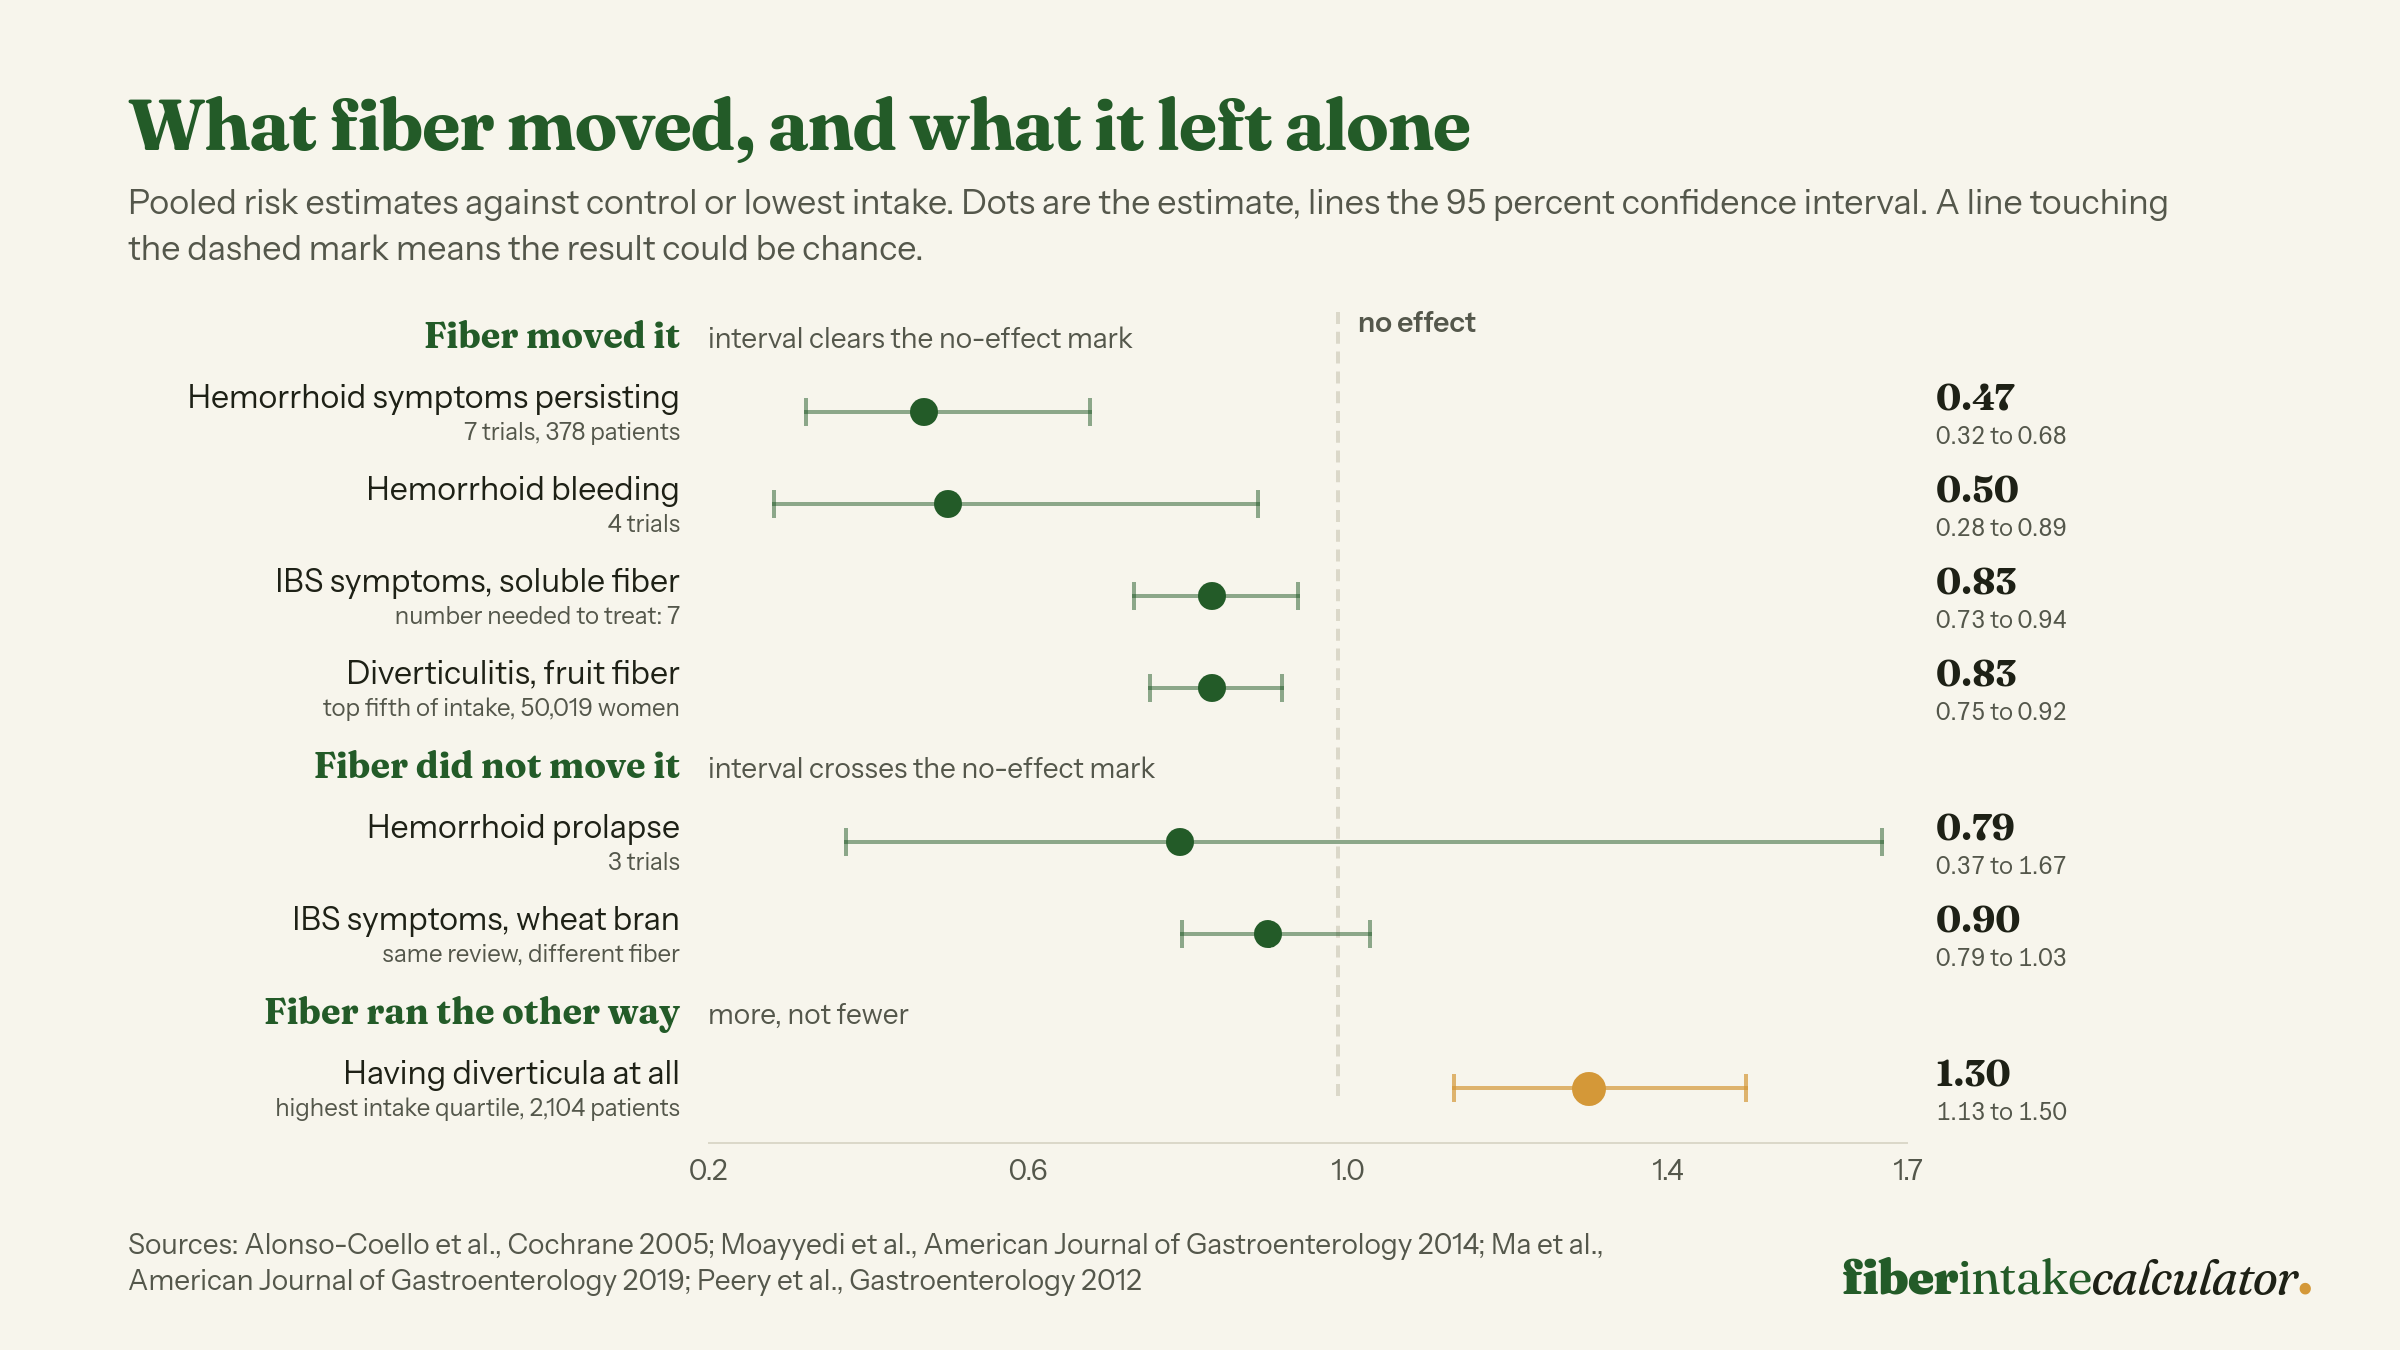
Three results stand out.
Hemorrhoid prolapse did not move, at RR 0.79 with a confidence interval from 0.37 to 1.67. The Cochrane authors give the reason plainly: prolapse is a structural change, and connective tissue does not recover because stool got softer. Bleeding halved, prolapse did not, and our fiber for hemorrhoids page carries the full outcome-by-outcome split.
Wheat bran did not help irritable bowel syndrome, at RR 0.90 (0.79 to 1.03), in the same review where soluble fiber worked at 0.83. The overall figure that gets quoted, RR 0.86, averages a fiber that worked with one that did not. Bran was also the arm people quit: 18 of 97 patients stopped it for intolerance in the main trial against 7 of 85 on psyllium, and our page on fiber for IBS has the dose, the month-by-month responder rates and the guideline grading behind that split.
Fiber tracked with more diverticula, not fewer. In 2,104 colonoscopy patients, the highest intake quartile had a prevalence ratio of 1.30 (1.13 to 1.50) for having the pouches at all, while a separate cohort found high intake lowering the risk of those pouches becoming inflamed. Both are true because they measure different things, which our diverticulitis page works through in detail.
Which fiber, not how much fiber
In most conditions where the two have been compared head to head, the type of fiber decided the result. Diabetes is the exception, and it is a useful one.
| Condition | What worked | What did not | Study |
|---|---|---|---|
| Irritable bowel syndrome | Soluble fiber, RR 0.83 (0.73 to 0.94), NNT 7 | Wheat bran, RR 0.90 (0.79 to 1.03) | Moayyedi 2014 |
| Diverticulitis | Fruit fiber, HR 0.83 (0.75 to 0.92) | Vegetable fiber, HR 0.92 (0.83 to 1.01) | Ma 2019 |
| Hemorrhoids | Bulk-forming supplements, 7 to 20 g a day | No trial tested a high-fiber food diet | Cochrane 2005 |
| High cholesterol | Soluble fiber, LDL -2.2 mg/dL per gram a day | Insoluble fiber has no measured lipid effect | Brown 1999 |
| Diabetes | Total grams, whatever the source | Fiber type predicted nothing: no difference on HbA1c or glucose | Reynolds 2020 |
| Gut bacteria | Fructans and galacto-oligosaccharides, both genera | Alpha diversity, acetate, propionate and every other group measured | So 2018 |
The diabetes row is worth dwelling on, because it is the one place the popular rule fails. Meta regression across 42 trials found that fiber type did not influence the improvement in HbA1c, fasting glucose or any lipid marker, which is the opposite of what almost every page on that subject says. Our fiber for diabetes page works through that analysis marker by marker.
The gut bacteria row runs the other way again, and more narrowly than the usual advice: across 64 trials it was two specific fiber families that moved the numbers, while bacterial diversity did not move at all. Our page on high-fiber foods for gut health carries every effect size and the daily dose at which each fiber type changed something.
Which makes the soluble and insoluble split more than a textbook distinction. Soluble fiber is the one with the cholesterol and irritable bowel evidence behind it, and USDA’s database does not track it, so the numbers have to come from published analyses. The insoluble fiber table covers the other half, the one that does the bulking.
The cholesterol effect is real and small. Brown and colleagues put the worked example in their own abstract: 3 grams of soluble fiber from oats, about three servings of oatmeal, lowers total and LDL cholesterol by roughly 5 mg/dL. Useful, and not a statin.
What those doses look like as food
Grams on a chart are abstract. Here is each threshold built from single servings, using USDA values.
| Target | One way to get there | Fiber |
|---|---|---|
| 10 g constipation trials | 1 cup cooked lentils (15.6 g) on its own, or 1 cup raspberries plus 1 medium apple | 12.4 g |
| 25 g diverticulitis, lower disease risk | 1 cup cooked black beans, 1 cup raspberries, 1 medium pear, 1 cup cooked broccoli | 33.6 g |
| 35 g diabetes management | 1 cup cooked split peas, 1 cup cooked bulgur, 1 medium artichoke, 1 oz almonds | 38.3 g |
Legumes carry most of the load in all three rows, which is the pattern our high-fiber foods chart makes obvious and our legume ranking computes in full from USDA records. If you would rather take a dose than cook one, the labeled serving of the products in our fiber supplement comparison runs from 0.5 to 9 grams, so most of them cannot reach the constipation threshold on their own.
One caution that applies to every row: add fiber over weeks, not days. Every source on this subject says the same thing, because the bloating from a sudden jump is what makes people quit.
When more fiber is the wrong answer
Three situations reverse the advice, and all three are common enough to be worth naming.
- An acute diverticulitis flare. The AGA clinical practice update advises a clear liquid diet during the acute phase of uncomplicated diverticulitis, with patient comfort as the stated goal. If you cannot advance your diet after three to five days, that update says to contact your clinician immediately.
- Before a colonoscopy. Residue degrades the view, which is why preparation diets cut fiber rather than add it. Our colonoscopy prep page carries the trial evidence on how many days of restriction actually change the outcome.
- A prescribed low-residue period. Recovery from bowel surgery, a stricture, or an active flare of inflammatory bowel disease. The low-fiber diet page ranks the foods those diets allow and puts a gram ceiling on the day.
Weight is the one outcome that sits in between. Higher fiber intakes lowered body weight by 0.56 kg (95% CI 0.13 to 0.98) across 18 trials in adults with diabetes, which is real and modest, and our fiber for weight loss page scales the target to a deficit rather than promising the fiber does the work.
The condition pages
Each of these takes one condition apart at full length: what the trials gave people, what changed, and what the numbers in circulation get wrong.
- Fiber for constipation converts every trial arm into grams of food. The kiwifruit arm that tolerated best delivered 4.1 grams a day.
- Fiber for hemorrhoids splits the Cochrane review outcome by outcome. Bleeding halved, prolapse and itching did not move.
- Fiber for diverticulitis separates the two endpoints that run in opposite directions, and names the fiber source that carried the signal.
- Fiber for diabetes gives the effect size and evidence grade for every marker the trials measured, and ranks foods by fiber per gram of net carbohydrate.
- High-fiber foods for gut health puts the dose thresholds from eleven dose-ranging trials side by side, and explains why the fibers with the best bacterial evidence are partly missing from food tables.
Frequently asked questions
What diseases does fiber help prevent?
In the largest pooled analysis of the question, 185 prospective studies and 58 trials covering just under 135 million person-years, the people eating the most fiber had a 15 to 30 percent lower rate of all-cause mortality, cardiovascular mortality, coronary heart disease, stroke, type 2 diabetes and colorectal cancer than the people eating the least. The dose-response curve was steepest between 25 and 29 grams a day (Reynolds et al., Lancet 2019). That is prevention in a general population, not treatment of an existing condition, and the two need to be kept apart.
Which conditions does fiber actually treat rather than prevent?
Three have randomized trial evidence for treating symptoms people already have. Chronic constipation: 66 percent of people responded to fiber against 41 percent on control, above 10 grams a day for at least four weeks (van der Schoot et al., 2022). Hemorrhoids: persisting symptoms fell by about half, RR 0.47 (95% CI 0.32 to 0.68), on bulk-forming supplements at 7 to 20 grams a day (Cochrane 2005). Irritable bowel syndrome: symptoms persisted less often on fiber, RR 0.86 (0.80 to 0.94), with a number needed to treat of 10 (Moayyedi et al., 2014). Everything else on the usual benefits list is prevention or risk-factor improvement.
What type of fiber is best for each condition?
The type matters more than the total in the three places it has been tested head to head. In irritable bowel syndrome, soluble fiber worked at RR 0.83 (95% CI 0.73 to 0.94, NNT 7) and wheat bran did not, at RR 0.90 (0.79 to 1.03). In diverticulitis, fruit fiber carried the signal at HR 0.83 (0.75 to 0.92) while vegetable fiber showed nothing measurable at 0.92 (0.83 to 1.01). In hemorrhoids, every one of the seven trials used a bulk-forming supplement such as psyllium or ispaghula. For cholesterol, only soluble fiber has a measured effect.
How much fiber do I need for a specific condition?
It is not one number, and it is usually below the general daily target. Constipation trials found the effect above 10 grams a day. Hemorrhoid trials used 7 to 20 grams of a bulk-forming supplement. Diverticulitis risk dropped at 25 grams a day or more. Population disease risk falls fastest between 25 and 29 grams. Diabetes management studies point at 35 grams a day, or 15 grams above your current intake. Your general daily target from the calculator is a separate figure, set for overall health rather than for any of these conditions.
Can fiber make a condition worse?
It can be the wrong move in three situations, all documented. During an acute diverticulitis flare the AGA practice update advises a clear liquid diet, with patient comfort as the stated goal. Before a colonoscopy, fiber is restricted because residue degrades the view. And in one colonoscopy study of 2,104 patients, the quartile eating the most fiber had more diverticula, not fewer, at a prevalence ratio of 1.30 (95% CI 1.13 to 1.50). Wheat bran also failed to help irritable bowel syndrome, and adding any fiber faster than a few grams a week reliably causes bloating.
Built and maintained by the FiberIntake team, with data from USDA FoodData Central and peer-reviewed sources. Figures are checked against the cited source before publish. About this site →