What Does Fiber Do?
Last updated: September 30, 2026
Fiber does three physical things: it adds bulk, some of it holds water as a gel, and gut bacteria ferment the rest. Every benefit on every fiber page is one of those three jobs having an effect somewhere downstream.
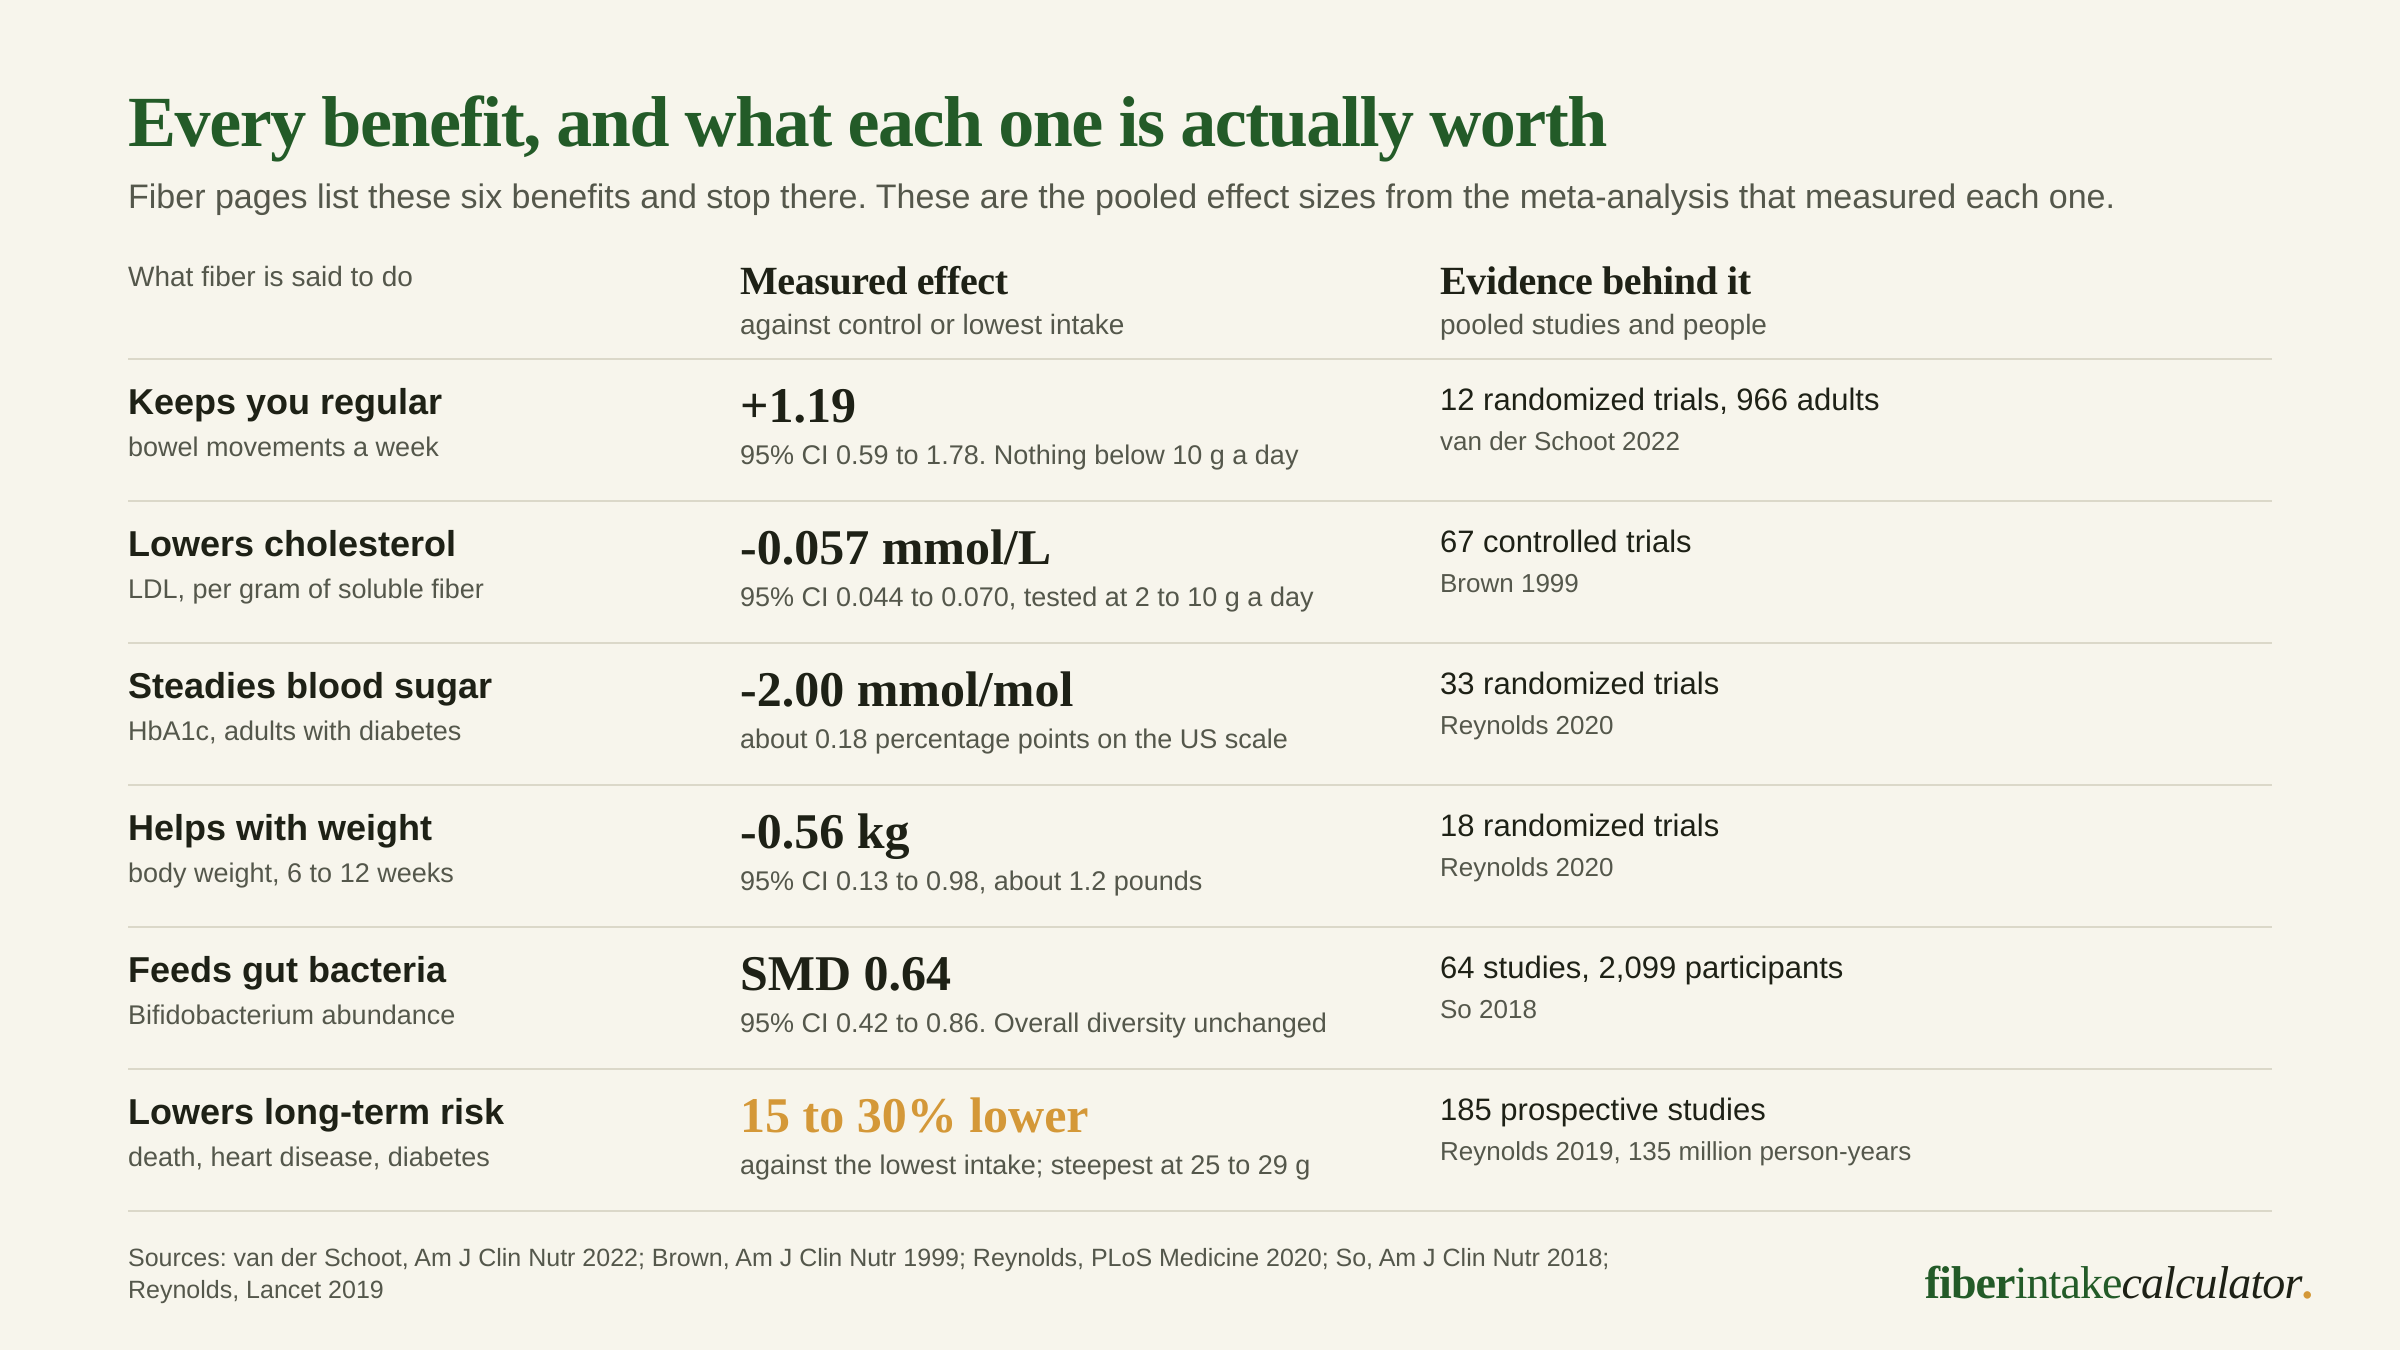
The jobs have measured sizes, and the sizes are not similar. Regularity moves by 1.19 bowel movements a week. LDL cholesterol falls 0.057 mmol/L for each gram of soluble fiber a day. Body weight moves 0.56 kg. Long-term disease rates move 15 to 30 percent.
This page walks the three mechanisms, prices each benefit, and shows where the usual soluble and insoluble story stops predicting anything. If you want your own daily target before any of that, the fiber calculator computes it from your height, weight, age and activity.
The three jobs, and which fibers do them
A fiber’s effect depends on three properties: how coarse its particles are, whether it forms a gel and holds water, and whether bacteria ferment it before it reaches the stool.
| The job | What physically happens | Fibers that do it | What it produces |
|---|---|---|---|
| Bulk | Coarse particles resist fermentation and mechanically irritate the gut lining, which raises water and mucus secretion | Coarse wheat bran, cellulose, lignins, vegetable and fruit skins | Softer, heavier stool and faster transit |
| Gel | The fiber dissolves into a viscous gel that holds water and slows how fast the gut empties | Psyllium, oat and barley beta-glucan, pectin, guar gum, chia mucilage | Lower LDL cholesterol, flatter blood sugar, longer fullness |
| Fermentation | Colon bacteria consume the fiber and turn it into short-chain fatty acids, gas and more bacteria | Inulin, oligosaccharides, resistant starch, wheat dextrin, beta-glucan | More Bifidobacterium and Lactobacillus, more butyrate, more gas |
Read the third column twice. Beta-glucan is on two rows, because it gels and is then fermented, and that is not a contradiction: a fiber can do one job in the small intestine and a different one in the colon. What it cannot do is be in two places at once. A fiber bacteria have finished eating is not in the stool any more, which is why the fermented column produces gas and bacteria rather than bulk.
The one rule that explains most of the confusion: a fiber can only bulk or soften a stool if it survives to the stool. That single test separates coarse wheat bran and psyllium, which both arrive intact, from inulin, wheat dextrin and guar gum, which do not.
What each benefit is actually worth
Every page on this subject lists the same benefits. Almost none of them says how big any of them is. Here is each one with the pooled effect size, the trial base behind it, and the condition attached to it.
| Benefit | Measured effect | The mechanism behind it | Evidence |
|---|---|---|---|
| Bowel movements a week | +1.19 95% CI 0.59 to 1.78 | Bulk, and gel that survives fermentation | 12 randomized trials, 966 adults |
| People who responded | 66% vs 41% RR 1.48 (1.17 to 1.88) | Same | Same pooled analysis |
| LDL cholesterol, per gram of soluble fiber a day | -0.057 mmol/L 95% CI 0.044 to 0.070 | Gel binds bile acids, the liver pulls cholesterol from blood to replace them | 67 controlled trials, tested at 2 to 10 g a day |
| HbA1c in adults with diabetes | -2.00 mmol/mol about 0.18 points | Gel slows gastric emptying and glucose absorption | 33 randomized trials |
| Body weight | -0.56 kg 95% CI 0.13 to 0.98 | Gel and bulk both extend fullness; fiber itself carries almost no calories | 18 randomized trials, 6 to 12 weeks |
| Bifidobacterium abundance | SMD 0.64 95% CI 0.42 to 0.86 | Fermentation | 64 studies, 2,099 participants |
| Fecal butyrate | SMD 0.24 95% CI 0.00 to 0.47 | Fermentation | Same pooled analysis |
| Irritable bowel syndrome symptoms | RR 0.86, NNT 10 soluble alone 0.83, NNT 7 | Gel; bran alone was not significant at 0.90 | 14 randomized trials, 906 patients |
| Death, heart disease, stroke, type 2 diabetes, colorectal cancer | 15 to 30% lower | All three, plus the foods fiber travels in | 185 prospective studies, just under 135 million person-years |
Two rows change how the rest should be read.
The regularity row carries a dose floor that almost nobody prints. Pooled across doses above 10 grams a day of added fiber, stool frequency rose 1.60 a week. At 10 grams a day or less, it did not move at all. The average benefit of 1.19 is an average over trials that include doses too small to do anything.
The cholesterol row is per gram, which makes it unusually easy to act on. Three grams of soluble fiber from oats, which is the amount FDA ties to the oat heart claim, lowers total and LDL cholesterol by about 0.13 mmol/L. Our soluble fiber calculator adds up a day of those grams against that 3 gram level and the 7 gram psyllium level in the same federal rule.
Soluble and insoluble predicts less than every page claims
The standard explanation assigns laxation to insoluble fiber and cholesterol lowering to soluble fiber. It is repeated by Google’s AI Overview, by Mayo Clinic, by Harvard and by every hospital blog ranking for this question. Four cases show what it gets wrong.
| Fiber | Soluble? | Does it loosen stool? | Why |
|---|---|---|---|
| Coarse wheat bran | No | Yes | Large rough particles survive fermentation and irritate the gut lining into secreting water |
| Finely ground wheat bran | No | No | Same fiber, same grain. The particles are too small to do the mechanical work |
| Psyllium | Yes | Yes | Gels, and is not fermented, so the water it holds is still there at the end of the colon |
| Oat beta-glucan | Yes | No | Gels, then gets fermented. It lowers LDL cholesterol; it does not loosen stool |
Two of those rows are the same fiber from the same grain, separated only by how finely it was milled. Solubility cannot explain a difference it does not vary across. Particle size can.
The randomized trials agree from a completely different direction. Psyllium, soluble and not fermented, raised stool frequency by 3.08 bowel movements a week. Galacto-oligosaccharides, also soluble and rapidly fermented, raised it by 0.71. Same solubility, four times the difference.
This is why our pages on soluble fiber and insoluble fiber publish the gram splits rather than the usual definitions: the split is worth knowing, it just is not the thing that predicts what happens. Our side-by-side comparison of the two puts the pooled effect size on each goal next to the type that produced it, which is where the limits of the split show. The full fermentation argument, with both the mechanism and the trial evidence, sits on our page about whether fiber makes you poop.
What one ordinary portion is worth
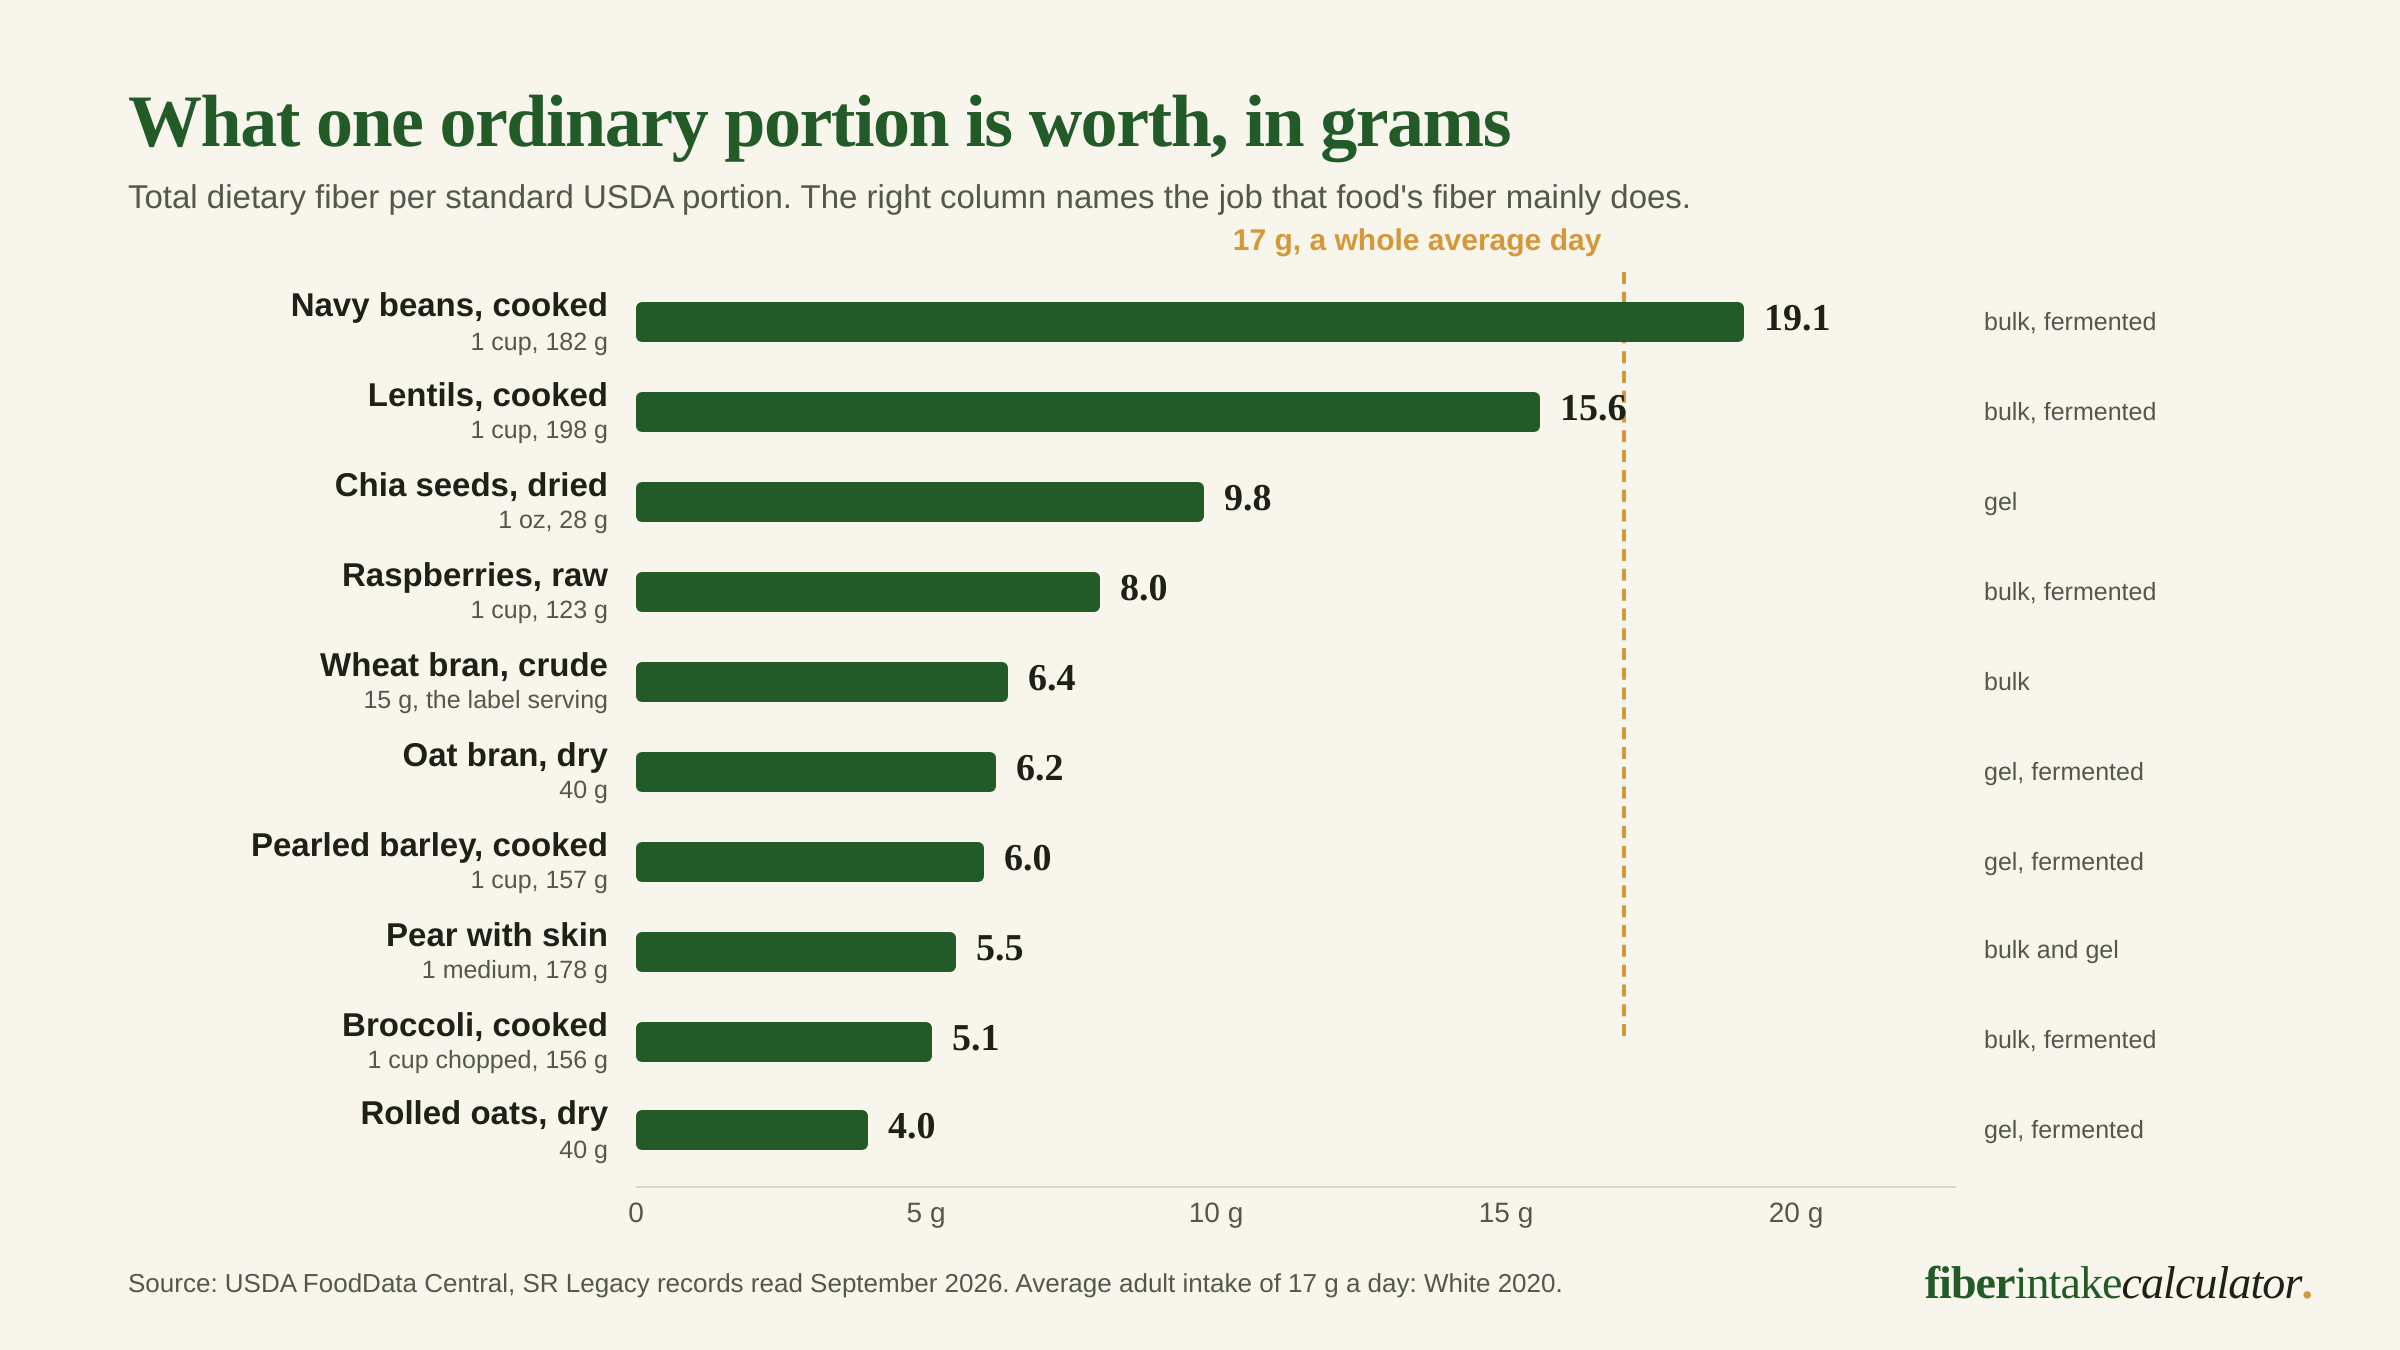
Mechanisms are only useful in grams. These are USDA FoodData Central records, multiplied by the portion weight carried on the same record.
| Food | Portion | Fiber | Per 100 g | Main job |
|---|---|---|---|---|
| Navy beans, cooked | 1 cup, 182 g | 19.1 g | 10.5 g | Bulk, fermented |
| Lentils, cooked | 1 cup, 198 g | 15.6 g | 7.9 g | Bulk, fermented |
| Chia seeds, dried | 1 oz, 28 g | 9.8 g | 34.4 g | Gel |
| Raspberries, raw | 1 cup, 123 g | 8.0 g | 6.5 g | Bulk, fermented |
| Wheat bran, crude | 15 g label serving | 6.4 g | 42.8 g | Bulk |
| Oat bran, dry | 40 g | 6.2 g | 15.4 g | Gel, then fermented |
| Pearled barley, cooked | 1 cup, 157 g | 6.0 g | 3.8 g | Gel, then fermented |
| Pear with skin | 1 medium, 178 g | 5.5 g | 3.1 g | Bulk and gel |
| Broccoli, cooked | 1 cup chopped, 156 g | 5.1 g | 3.3 g | Bulk, fermented |
| Rolled oats, dry | 40 g | 4.0 g | 10.1 g | Gel, then fermented |
The fourth column is why per-100-gram lists mislead. Wheat bran is 42.8 grams of fiber per 100 grams, four times the density of navy beans, and a realistic serving of it delivers a third as much, because nobody eats 100 grams of bran. Both numbers are true and they answer different questions. Our high-fiber foods rankings sort every group on the serving basis for that reason, with the bean and legume tables and the whole grains ranking showing where the biggest single portions live.
One cup of cooked navy beans is 19.1 grams, more than the whole average US adult day of 17 grams. That is the fastest available answer to the question of how anyone reaches 25 or 38 grams: one legume portion does most of the work, and everything else fills in.
What fiber does not do
The honest subtractions matter as much as the benefits, and they come from the same meta-analyses.
It does not increase gut bacterial diversity. Across 64 studies in 2,099 healthy participants, fiber raised Bifidobacterium and Lactobacillus and left alpha diversity unchanged. Most of the other prespecified bacteria and most of the other short-chain fatty acids did not move either. The specific direction is real; the general “more diverse microbiome” claim is not what was measured. Our page on fiber and gut health works through the full result including the dose-ranging trials.
It did not lower blood pressure in the trials that tested it in adults with diabetes, even while it moved HbA1c, fasting glucose, weight and cholesterol in the same analysis. That is one of the seven benefits Houston Methodist’s page lists.
It does not work quickly. Pooled across every trial length, fiber did not significantly change whole gut transit time. Restrict the pooling to trials of four weeks or longer and transit time fell 18.4 hours. Anyone judging a change after a few days is reading noise.
It reliably produces gas. Flatulence was significantly higher on fiber than on control at a standardised mean difference of 0.80, which is a larger effect than any of the benefits in the same analysis. That is fermentation working, not a mistake, but it explains why most people quit in week one: the gas arrives before the benefit does. Adding a few grams a week rather than a day is the fix, and our page on pushing fiber intake high sets out the ramp.
More is not always better. In one published cohort, 41 adults with idiopathic constipation who were already on a high-fiber diet stopped fiber completely and went from one bowel movement every 3.75 days to one a day. That study had no control group and everyone in it had already failed on fiber, so it identifies a subgroup rather than overturning the trials. Our low-fiber diet guide covers what a deliberate reduction looks like.
How much you need, and how far off most people are
| Number | What it is | Who sets it |
|---|---|---|
| 25 g / 38 g | Adequate Intake, women and men aged 19 to 50 | Institute of Medicine, 2005 |
| 21 g / 30 g | The same, after age 50 | Institute of Medicine, 2005 |
| 14 g | Per 1,000 calories eaten, the basis all four numbers come from | Institute of Medicine, 2005 |
| 28 g | Daily Value printed on Nutrition Facts labels | FDA, 21 CFR 101.9(c)(9) |
| 25 to 29 g | Where the population risk curve falls fastest | Reynolds, Lancet 2019 |
| 17 g | What the average US adult actually eats | NHANES, via White 2020 |
| about 5% | Share of the population meeting the recommendation | Quagliani and Felt-Gunderson, 2017 |
The gap between the last two rows and the rest is the whole story. The mechanisms are settled, the effect sizes are measured, and almost nobody is eating enough for any of it to apply.
Your own number depends on your calorie intake rather than on a category, which is what the 14 grams per 1,000 calories basis means. The fiber calculator works it out and converts it into portions. If the target looks far away, fiber for constipation, fiber for diabetes and fiber for weight loss each show what the trials on that goal actually used, and the fiber supplement comparison reads the Supplement Facts panel on twelve products if you would rather close the gap from a jar.
Where the numbers come from
The stool frequency, responder, consistency, transit time and flatulence figures are from van der Schoot and colleagues, 2022, in the American Journal of Clinical Nutrition, pooling 16 randomized controlled trials in 1,251 adults with chronic constipation. The cholesterol figure is from Brown and colleagues, 1999, in the same journal, pooling 67 controlled trials. The HbA1c, body weight and blood pressure figures are from Reynolds, Akerman and Mann, 2020, in PLoS Medicine. The gut bacteria figures are from So and colleagues, 2018, in the American Journal of Clinical Nutrition, pooling 64 studies in 2,099 participants. The population risk figures are from Reynolds and colleagues, 2019, in The Lancet, covering 185 prospective studies and just under 135 million person-years. The irritable bowel figures are from Moayyedi and colleagues, 2014, in the American Journal of Gastroenterology.
The mechanism account is from McRorie and McKeown, 2017, in the Journal of the Academy of Nutrition and Dietetics, and White, 2020, in the American Journal of Lifestyle Medicine, which declares no funding and no conflicts of interest. Food figures are USDA FoodData Central SR Legacy records read in September 2026, with each per-portion value computed as fiber per 100 grams times the portion weight on the same record. Full references sit on our sources page, and the way we compute and check every number is on our methodology page.
Frequently asked questions
What does fiber do for your body?
Three physical things, and everything else follows from them. Fiber adds bulk that the gut cannot absorb, some of it holds water as a gel through the whole large bowel, and gut bacteria ferment the rest into short-chain fatty acids and gas. Those three jobs produce the measured effects: 1.19 more bowel movements a week against control, LDL cholesterol down 0.057 mmol/L for every gram of soluble fiber a day, HbA1c down about 0.18 percentage points, body weight down 0.56 kg, more Bifidobacterium at a standardised mean difference of 0.64, and 15 to 30 percent lower rates of death, heart disease, stroke, type 2 diabetes and colorectal cancer in the highest consumers against the lowest.
Does fiber clean out your gut?
Not in the way the phrase suggests. Nothing scrubs. What happens is that the fiber your bacteria cannot reach adds mass and water to stool, and the fiber they can reach gets eaten. In the pooled trial data, feeding gut bacteria raised Bifidobacterium at a standardised mean difference of 0.64 and Lactobacillus at 0.22, but overall bacterial diversity did not change, and neither did most of the other short-chain fatty acids measured. Fiber moves the population in a specific direction rather than cleaning anything.
What happens when you lack fiber?
Mostly nothing you can feel, which is the problem. The average US adult eats about 17 grams a day against an Adequate Intake of 25 grams for women and 38 for men to age 50, and about 5 percent of the population meets the recommendation. There is no symptom that reliably identifies low intake. What the population data shows is the far end of it: the curve linking fiber to lower rates of death, heart disease, stroke, type 2 diabetes and colorectal cancer falls fastest between 25 and 29 grams a day, which is a band most people never reach.
What are signs that you need more fiber?
There are no reliable signs, and lists that name some are guessing. Constipation has many causes other than fiber, and the trial evidence shows a subgroup of people whose constipation improved when they ate less of it. Hunger, bloating and irregular stools all have the same problem: they do not distinguish a low-fiber diet from a dozen other things. Counting grams for two or three days answers the question in a way symptoms cannot. Our calculator gives you the target to count against.
Is soluble or insoluble fiber better?
The question is built on an axis that does not predict much. Coarse wheat bran is insoluble and laxative; finely ground bran from the same grain is not. Psyllium is soluble and laxative; the beta-glucan in oats is soluble and not laxative, though it does lower LDL cholesterol. What predicts an effect is whether the fiber forms a gel, how coarse its particles are, and whether bacteria ferment it before it reaches the stool. Solubility only sometimes tracks those, which is why the food advice built on it keeps contradicting itself.
Built and maintained by the FiberIntake team, with data from USDA FoodData Central and peer-reviewed sources. Figures are checked against the cited source before publish. About this site →